This analysis is based on 5,670,733 articles and social posts monitored across Bulgaria, Serbia, Romania, Greece and Hungary during Q1 2026. Data was collected and processed by Pikasa Analytics using Analytics.Live proprietary platform for monitoring media and all major social platforms. This analysis is focused on Bulgarian and Serbia business markets.
Executive Snapshot
- 5,670,733 total articles and social posts monitored across five countries in Q1 2026 - one of the largest regional digital listening studies conducted in Southeast Europe
- 1,058,428,764 total engagements recorded across all content, all platforms and all markets combined
- Politics dominates press volume at 37.3% of all articles - yet culture content earns the highest average engagement per article at 26, more than any other category
- Companies represent less than 0.3% of total content yet the industrial category averages 12 engagements per article - outperforming sport, entertainment and lifestyle
- 57% of company press coverage is non-controlled - journalistic, critical and reactive - averaging 19 engagements per article versus 4 for controlled PR content
- Companies post on corporate time, audiences engage on personal time - publishing peaks at 10am, engagement peaks between 8pm and 9pm
- Facebook absorbs the majority of corporate content across every industry - not because it performs best, but because it is the default
By the Numbers
Five countries. One quarter. 5.7 million pieces of content generating over one billion engagements.
Pikasa Analytics tracked 5,670,733 total articles and social posts across Bulgaria, Serbia, Romania, Greece and Hungary in Q1 2026, with a combined engagement footprint of 1,058,428,764. The scale of the conversation is not the finding. The finding is who is having it - and who is not.
Politics dominates press volume at 37.3% of all articles. Foreign affairs follow at 18.8%. Diverse and general content accounts for 16.2%. Sport sits at 11.4%. Everything else - culture, lifestyle, economy, crime, health, opinions, technology, entertainment and industry - competes for the remaining 16% of press space. Companies, as a category, account for less than 0.3% of total content volume.
.webp)
Two things stand out immediately. Sport account for nearly 12% of all articles and average 10 engagements while culture accounts for 3.5% of articles and earns 19 average engagements - the highest of any category. Volume and engagement are inversely correlated across almost every content type. The most published categories earn the least response. The least published categories earn the most. This is not a social media finding. It is a structural truth about how attention works in digital media - and it applies equally to the 0.3% of content that companies produce.
Key Finding 1: Companies are almost invisible in the conversation - and when they appear, they rarely control the narrative
Less than 0.3% of all digital content across five markets and one quarter features companies as the primary subject. Of that fraction, 57% is non-controlled - meaning journalists, commentators and critics are writing about companies rather than companies writing about themselves. That non-controlled coverage averages 19 engagements per article. Controlled PR content averages 4.
.webp)
Companies appear in press predominantly as three things: villains in stories about prices, outages and scandals; political instruments in stories about regulation, government contracts and economic policy; or scenery in human drama where the brand is mentioned but not the focus. The electricity bill is going up. The network is going down. The construction permit that blocked someone's view. These are the moments when companies earn genuine press attention - not the product launch, the CSR initiative or the quarterly results.
The implication is direct. A company that only produces controlled content - press releases, sponsored articles, brand announcements - is producing content that earns a fraction of the audience response of the journalism it is trying to replace. The brands that earn genuine press attention do so by making decisions that give journalists a reason to write something the audience wants to read.
Key Finding 2: The timing gap is universal
Across all five markets and all industries monitored, companies publish content on corporate time. Posting volume peaks at 10am - when social media managers are at their desks, the brief has been approved and the coffee is fresh. Engagement peaks between 8pm and 9pm - when the audience is on the couch, phone in hand, with no work emails competing for attention.
The gap between 10am and 8pm is not a scheduling problem. It is a structural misalignment between how brands organise their communications teams and when audiences are actually available to receive them. A post published at 10am on a Tuesday competes with work emails, morning meetings and daily stress. The same post published at 8pm on a Tuesday competes with nothing except other content fighting for the same ten minutes of personal attention.
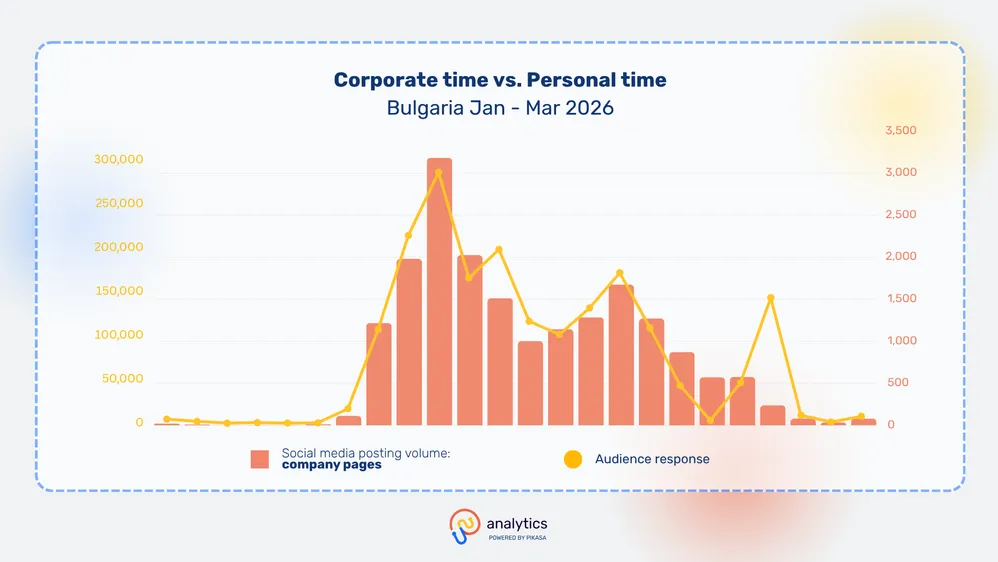
Non-company accounts - media, political, celebrity, community - do not follow the same pattern. Their posting volume is distributed across the full day and into the evening, matching the natural rhythm of the audiences they serve. Company accounts are the only category in the dataset that systematically publishes when their audience is least available to engage.
Key Finding 3: Platform choice reveals strategy - or the absence of it
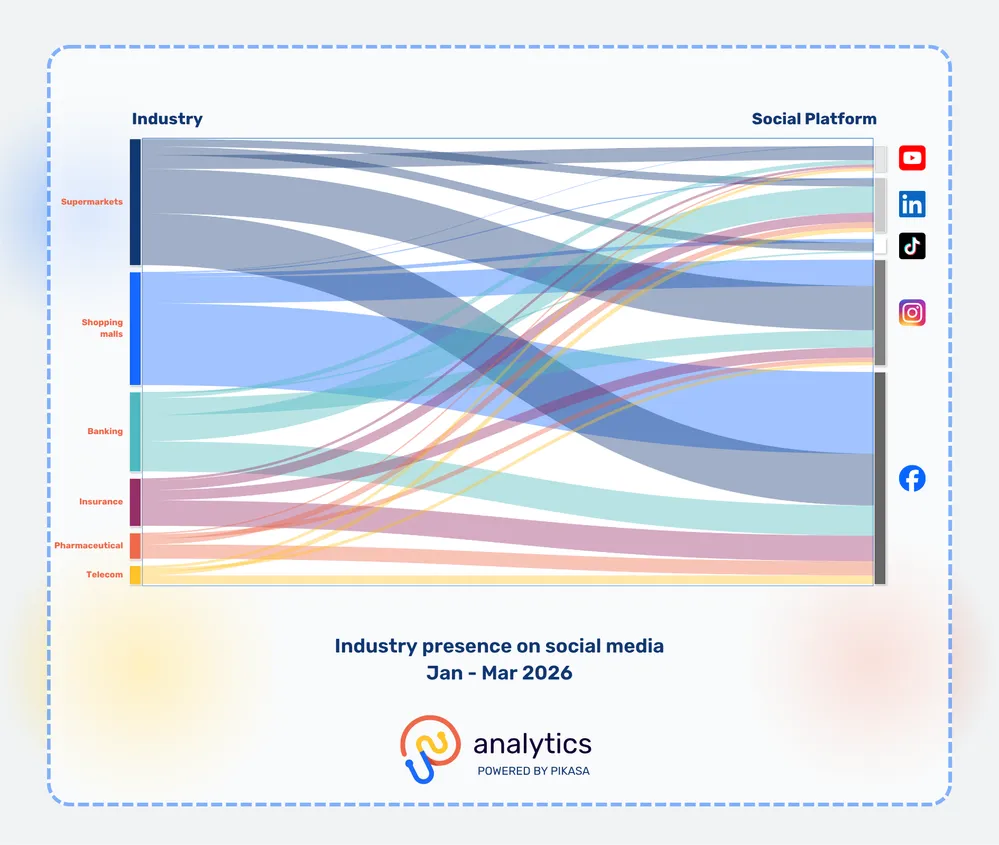
Facebook absorbs the majority of corporate content across every industry monitored. Banking, insurance, telecom, retail, luxury hotels - all show their largest content flow going to Facebook regardless of audience, brand or commercial objective. Not because Facebook delivers the best results for each sector. Because it is familiar, accessible and requires the least internal justification to use.
The Sankey analysis of Bulgarian industry presence on social media makes this visible at a glance. Every industry has its largest flow ending at Facebook's 6,232 posts. The exceptions are meaningful precisely because they are exceptions. TikTok belongs almost exclusively to shopping malls and supermarkets - the direct-to-consumer brands that need an audience to feel something before they walk through the door. LinkedIn is dominated by banking - the most formal sector chose the most formal platform. Supermarkets lead on YouTube - a bet on watch time and lifestyle content that earns consideration rather than a quick reaction.
The remaining industries - insurance, pharmaceutical, luxury hotels, telecom - send almost nothing to TikTok. Not because TikTok is wrong for them. Because nobody has made the decision to be there. The platform gap in corporate Bulgaria is not a technology gap. It is a decision gap. The companies winning on non-Facebook platforms made an active choice. Everyone else defaulted.
Key Finding 4: The engagement gap between companies and general accounts is widest on the platforms companies avoid
The analysis of Serbia and Bulgaria reveals the same pattern across both markets. On Facebook, the gap between company account engagement and general account engagement is relatively narrow. On Instagram it widens. On TikTok it becomes extreme - general accounts in Bulgaria average 1,593 engagements per post, company accounts average 180. In Serbia the gap is even larger.
LinkedIn is the only platform where company accounts perform close to the general account average - and that is not because companies are winning on LinkedIn. It is because everyone has low engagement there. The professional echo chamber produces consistent mediocrity across all account types.
.webp)
The platforms where the engagement gap is largest - TikTok and Instagram - are the platforms where audiences are most actively choosing what to watch, share and engage with. On these platforms the algorithm does not favour incumbency or budget. It favours content that earns attention. Companies that choose to compete there on the audience's terms - with content built for the platform rather than repurposed from other channels - are the ones closing the gap. The ones that avoid these platforms entirely are not saving resources. They are ceding the most valuable attention real estate in the digital landscape to competitors who showed up.
Methodology
Pikasa Analytics monitored all digital content -articles and social media posts - across Bulgaria, Serbia, Romania, Greece and Hungary during Q1 2026. The dataset covers news media, social platforms including Facebook, Instagram, LinkedIn, TikTok and YouTube, and company accounts across industries such as appliances stores, banking, insurance, luxury hotels, energy&mining, pharmaceutical, shopping malls, supermarkets, shipping&cargo and telecom. Engagement is defined as the sum of reactions, comments and shares across all platforms. Views and reach are tracked separately. Content categories were classified by topic using proprietary AI-assisted classification validated by analysts.
Written by
Natasha Dimova
May 21, 2026